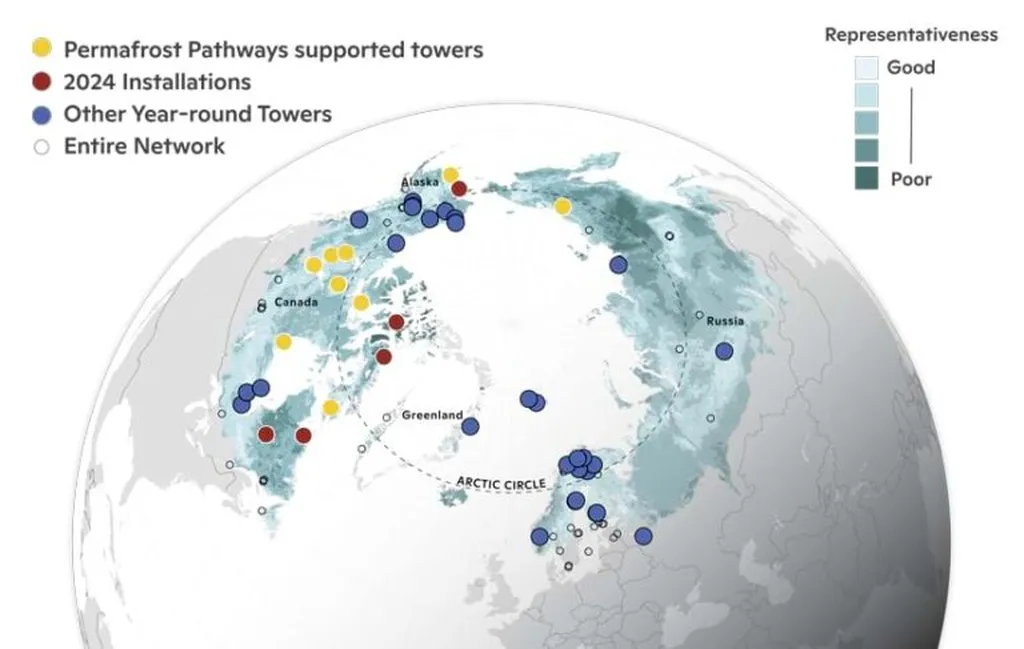
In the vast, frost-kissed expanses of the pan-Arctic region, a silent transformation is underway. As the climate warms, the frozen soils that have long locked away ancient carbon are beginning to thaw, with profound implications for the global energy sector. Accurately mapping these changes has been a challenge, but a novel scheme developed by Liyuan Chen and colleagues from Beijing Normal University is shedding new light on the dynamics of soil freeze depth (SFD), offering valuable insights for energy infrastructure planning and climate modeling.
The team’s work, published in the “International Journal of Geospatial Information and Earth Observation,” introduces MSFDmap, a monthly soil freeze depth mapping scheme that captures the spatiotemporal heterogeneity of heat transfer capability. This is a significant advancement over existing schemes, which primarily focus on annual maximum SFD values and often overlook the monthly variations and physical constraints that govern freeze-thaw cycles.
“Existing methods have struggled to capture the complexity of SFD dynamics,” explains Chen, lead author of the study. “By incorporating spatiotemporal heterogeneity in heat transfer capability, MSFDmap provides a more accurate and physically constrained representation of SFD.”
The MSFDmap scheme leverages the simplified Stefan equation, which is constrained by energy conservation principles, and employs a random forest regression model to predict the spatial distribution of monthly heat transfer factors. These factors are then used to map monthly SFD, providing a more nuanced understanding of the freeze-thaw processes that occur throughout the year.
The implications for the energy sector are substantial. Accurate SFD mapping is crucial for assessing the stability of infrastructure such as pipelines, roads, and buildings in permafrost regions. As the climate warms, thawing permafrost can lead to ground subsidence, increased erosion, and infrastructure damage, posing significant risks and costs to energy operations.
Moreover, understanding SFD dynamics is vital for predicting the release of greenhouse gases from thawing soils. As frozen organic matter thaws, it can decompose and release carbon dioxide and methane, further exacerbating climate change. By providing more accurate estimates of SFD, MSFDmap can enhance climate models and inform energy sector strategies for mitigating these impacts.
The team’s results demonstrate that MSFDmap outperforms existing schemes, achieving a root mean square error (RMSE) of 19.21 cm and an R2 of 0.91 for monthly SFD estimates. This represents a significant improvement over previous methods, which often exhibit higher errors and lower correlation coefficients.
“Our results show that MSFDmap effectively characterizes the spatiotemporal dynamics of monthly SFD,” says Chen. “This is a critical step forward in our understanding of frozen soils and their response to climate change.”
As the energy sector continues to grapple with the challenges posed by a warming climate, tools like MSFDmap will become increasingly valuable. By providing accurate, physically constrained estimates of SFD, this novel scheme can help energy companies and policymakers make informed decisions about infrastructure planning, climate adaptation, and greenhouse gas mitigation.
In the frosty expanses of the pan-Arctic, the ground is shifting—both literally and metaphorically. With MSFDmap, we now have a clearer view of these changes and a more accurate tool for navigating the complex landscape of frozen soils and their response to climate change. As Chen and colleagues continue to refine and expand their work, the energy sector can look forward to even greater insights and a more robust understanding of the challenges that lie ahead.

